Boost Control: Difference between revisions
| Line 175: | Line 175: | ||
[[File:Max-factor-pd.png]] | [[File:Max-factor-pd.png]] | ||
The calculation is <math> | The calculation is <math>P_{required} = \min(P_{pid}, P_{map}*factor)</math>. If, for example, the factor is 1.08, and the output of the PID is more than 10% more than the compressor map output then the DME will take the value from the compressor map. | ||
Notice that the factor is MAF dependent and | Notice that the factor is MAF dependent and | ||
Revision as of 10:34, 7 May 2024
Here we talk generally about how the B58 controls the turbo and more specifically about the maps you might need to recalibrate when changing from the stock turbo.
Boost control has several steps:
- Figure out the boost target
- Convert the boost target and error into power at the turbine wheel (i.e. how hard and fast the turbo should be spinning).
- Work out the power inherent in the exhaust flow and, thus, how much of that should be ejected through the wastegate.
- Work out the wastegate position to achieve that.
We note that we are controlling a single variable, the boost, but we have two parameters: the turbine power and the wastegate position with which to affect it. In effect, the turbine power is arbitrary. This makes the problem underconstrained. We will gain an understanding of the turbo control then look at ways to pin this down.
!!! WORK IN PROGRESS !!!
Boost setpoint
Here, the DME runs through conversions of temperature and pressure quantities to arrive at the target MAF and target boost pressure for the turbo. It also figures out the deviation of the current boost pressure from the target and the target exhaust massflow by summing the air mass flow and the fuel mass flow.
There are a number of limits applied...
Target massflow and pressure are both lowpass filtered using tables BMWtchsp_fac_FilPRatCmpr_T and BMWtchsp_fac_mf_FilCmprNorm_T. These contain massflow-dependent constant and are configured for stock-like flows of upto 1100 kg/h (about 305 g/s). Consider adjusting for larger turbos. For example:
Name: BMWtchsp_fac_FilPRatCmpr_T
Description: Filter constant for target pressure ratio
Unit info: kg/h --> -
Axis: BMWtchsp_fac_FilPRatCmpr_Ax
Base:
 200.000  300.000  900.000 1100.000
   0.120    0.120    0.070    0.030
Modified:
 200.000  300.000  900.000 1800.000
   0.120    0.120    0.070    0.030
Name: BMWtchsp_fac_mf_FilCmprNorm_T
Description: Filter constant for corr. Target mass flow
Unit info: kg/h --> -
Base:
 200.000  300.000 1100.000 1120.000
   0.120    0.100    0.100    0.020
Modified:
 200.000  300.000 1100.000 1800.000
   0.120    0.100    0.100    0.020
The following limit is applied to to the charge pipe pressure sensor:
Name: BMWtchsp_p_ReqMax_C
Description: Maximum target boost pressure due to diagnosis of the boost pressure sensor
Units: hPa
Base:
2500.000
Modified:
3000.000
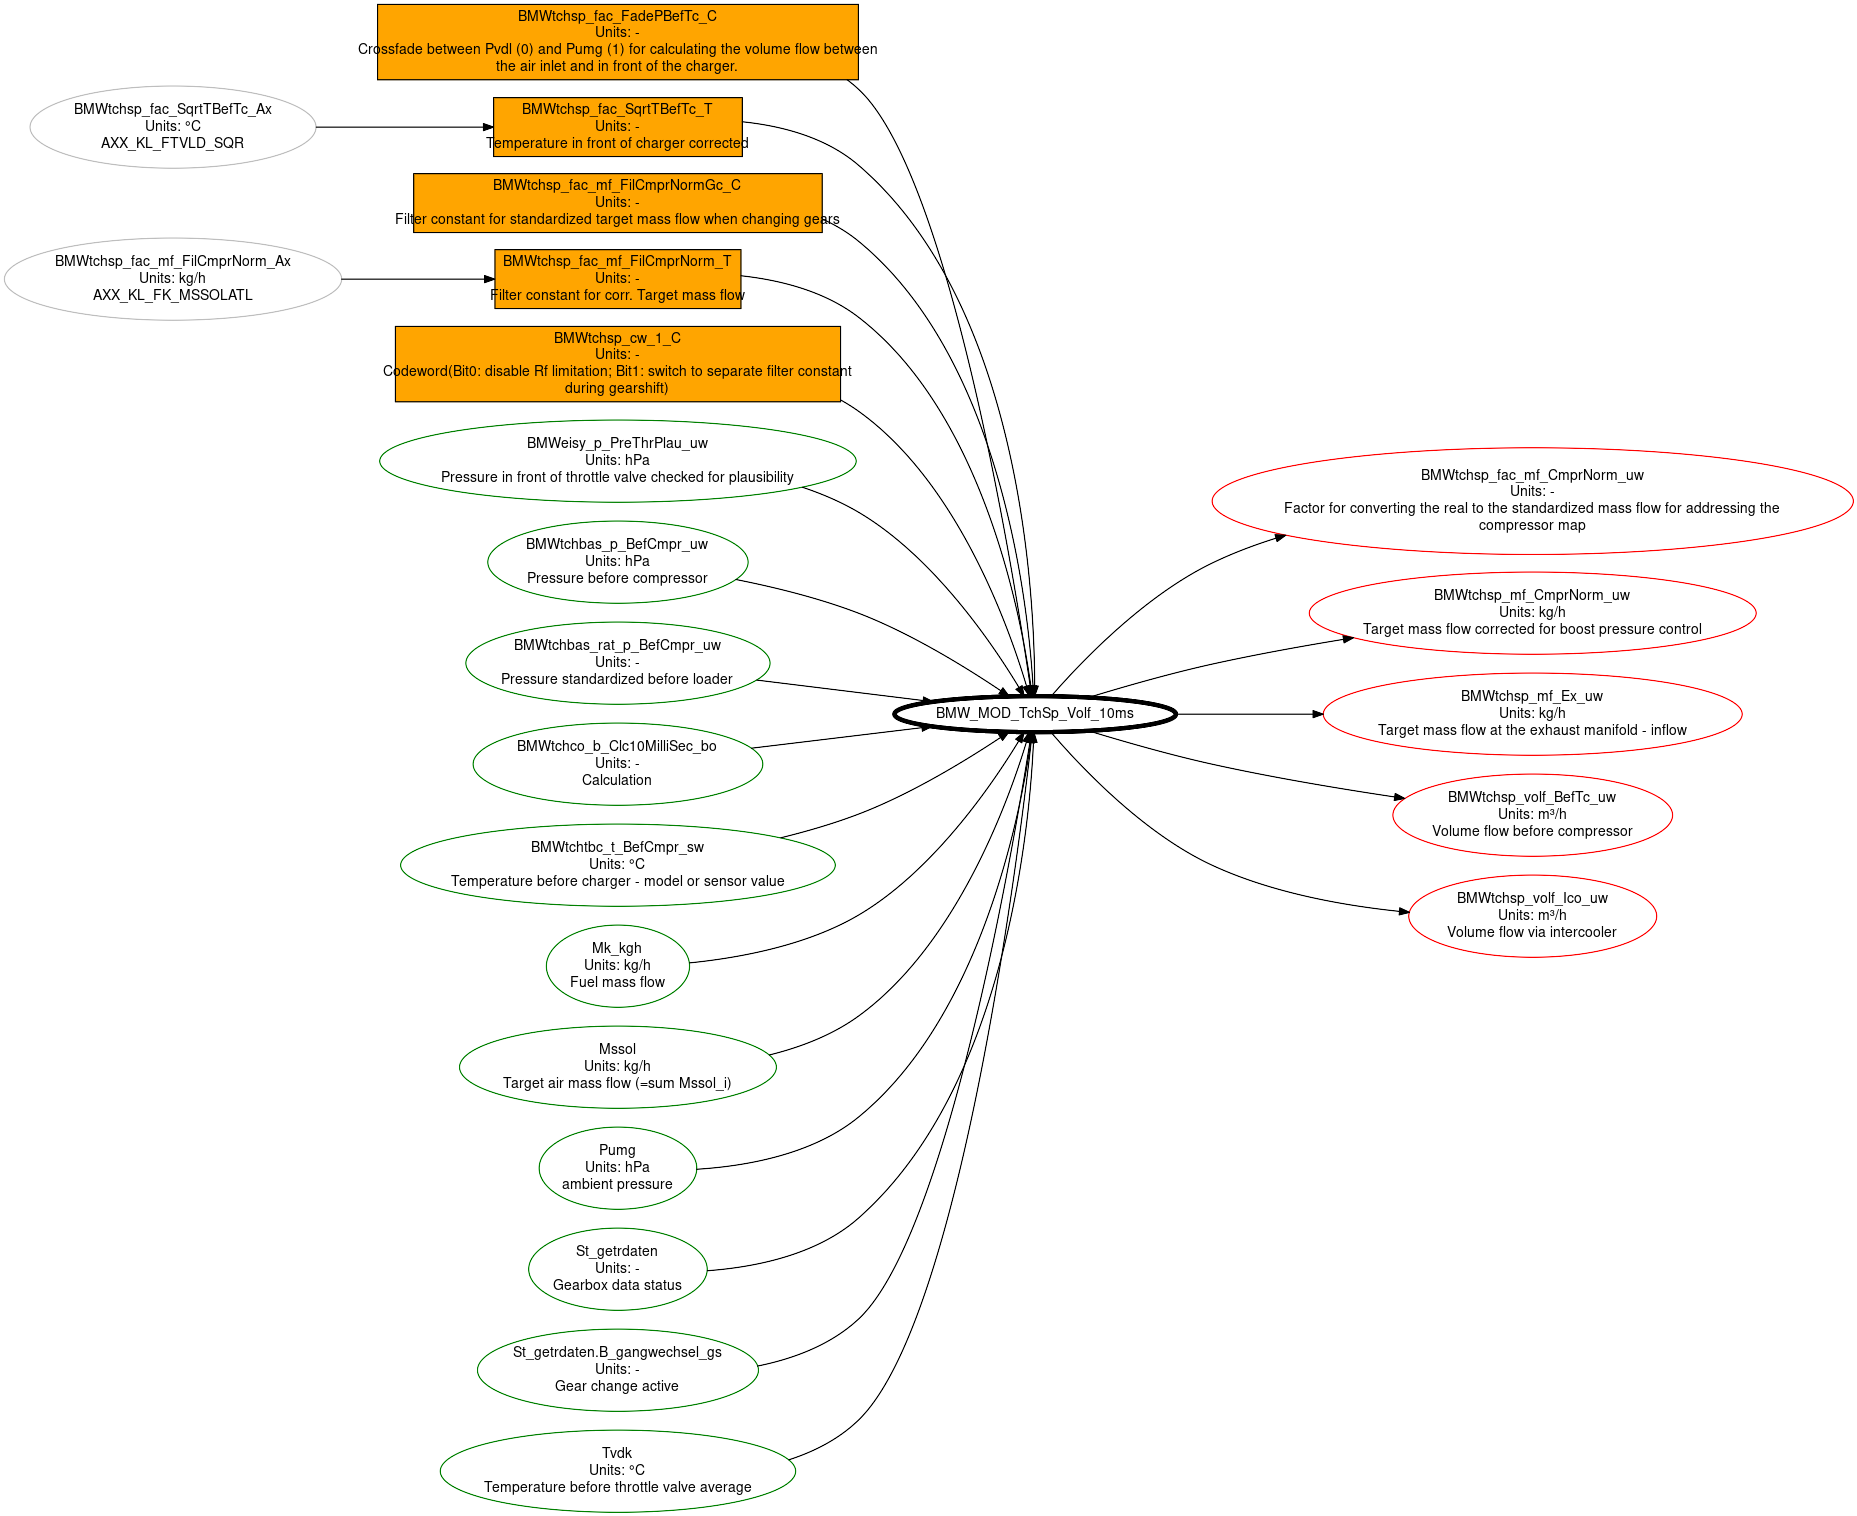
Maps feeding into the volume flow calculation are shown in orange below:
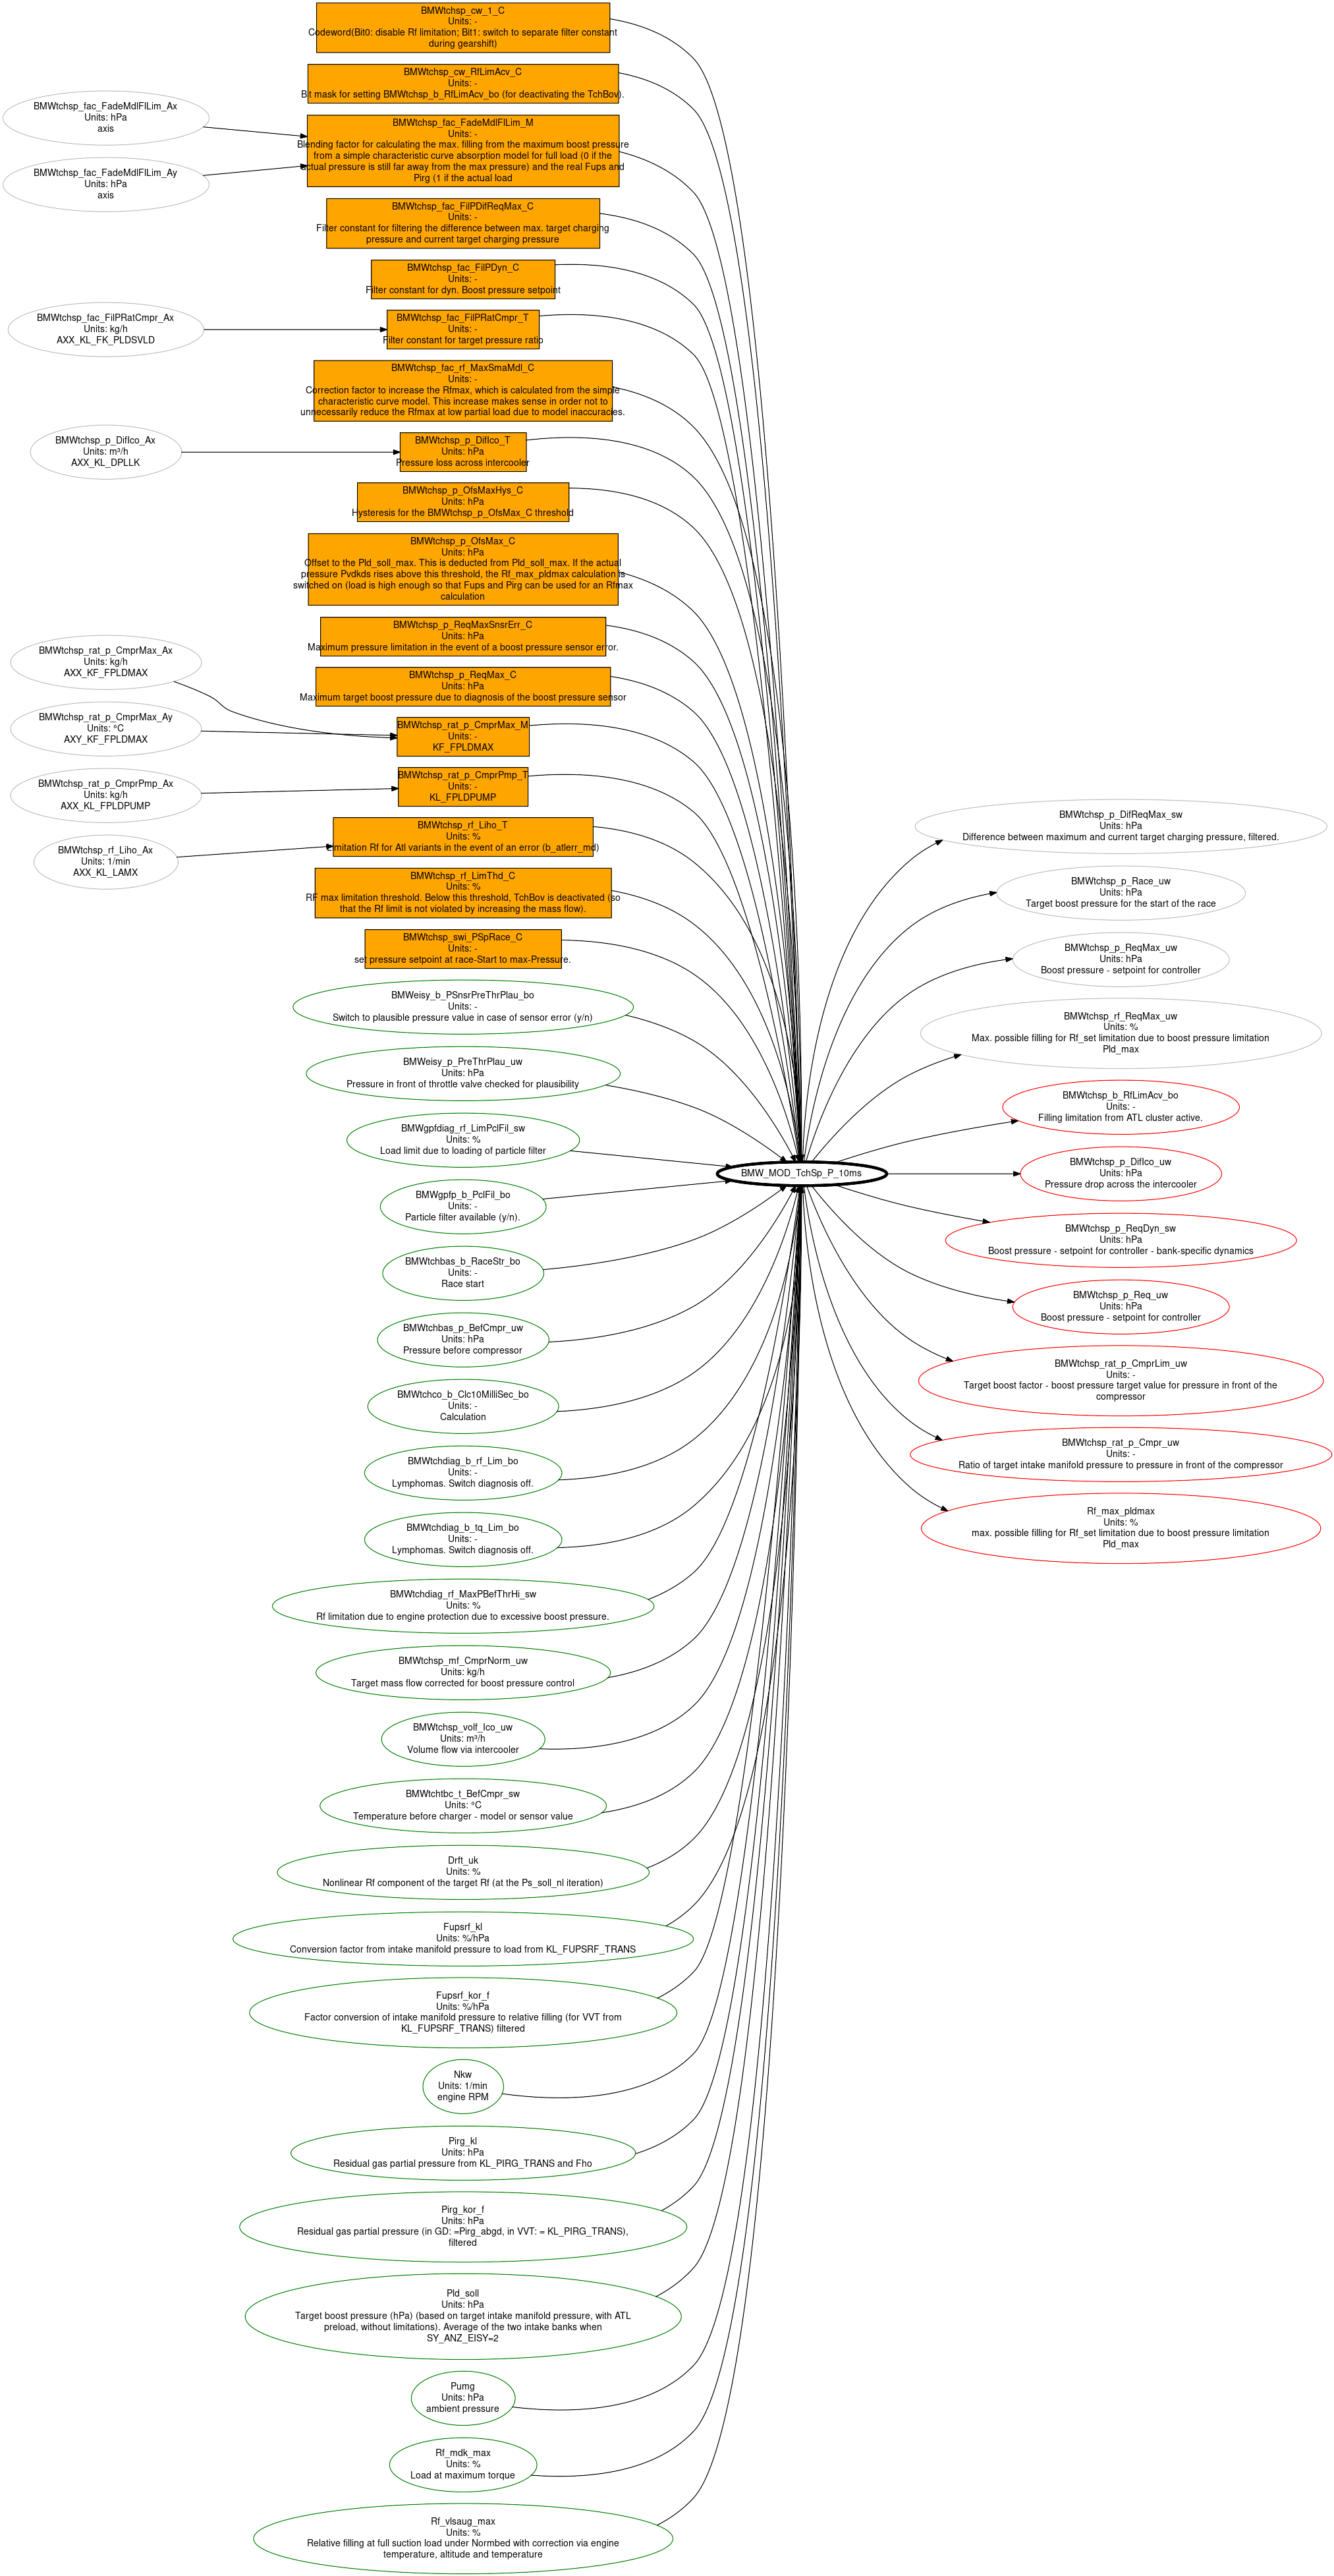
Maps feeding into the pressure calculation are shown below:
Power calculation (TchCtr_Pwr)
The first job of the boost controller is to work out how fast and hard is should be spinning the turbo to meet the required boost pressure. As such, (required) boost pressure quantities are converted into (required) power at the turbine wheel (in kW). Likewise boost errors are converted into power errors.
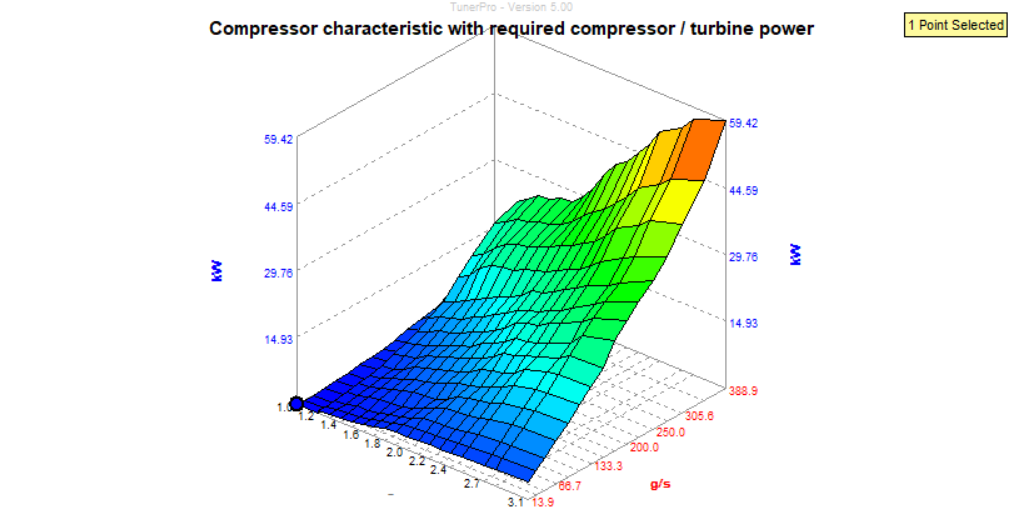
We can understand turbine power in terms of torque x rpm just as we can for engine power. As the boost pressure goes up, the air resistance on the compressor wheel also goes up so it needs more torque to keep turning at the same speed. As the engine speed rises and the airflow picks up, we can picture the compressor chasing the air and so it will have to rotate faster to create the same boost. For this reason, the compressor characteristic (BMWtchctr_pwr_Pctl_M) will tend to rise with pressure and with RPM:
Note that the boost axis does not have any units because the boost pressure in the chargepipe is divided by the pressure before the turbo. This value is often called boost presure ratio.
The pressure before the turbo is ambient pressure minus any pressure drop across the air filter. The more air pulled through the filter, the more that filter gets in the way and hence this pressure drop becomes higher as airflow increases.
Feed-forward compressor map
Initially, the DME creates a good guess at the required turbine power through a feed-forward map, called the compressor characteristic (BMWtchctr_pwr_Pctl_M). This outputs a feed-forward compressor power.
This is fairly straightforward to understand: the map represents the turbo's power at various airflow and pressure-ratio values. The DME reads these off, corrects for temperature and we're done.
Note that with different and possibly bigger turbos than stock
- They will flow more air so the MAF axis might require scaling up. A Pure800 would max out at about 500g/s for example.
- The power values might be lower not higher. In other words, if the turbo is operating more efficiently, it will generate the same MAF at lower power.
P error term
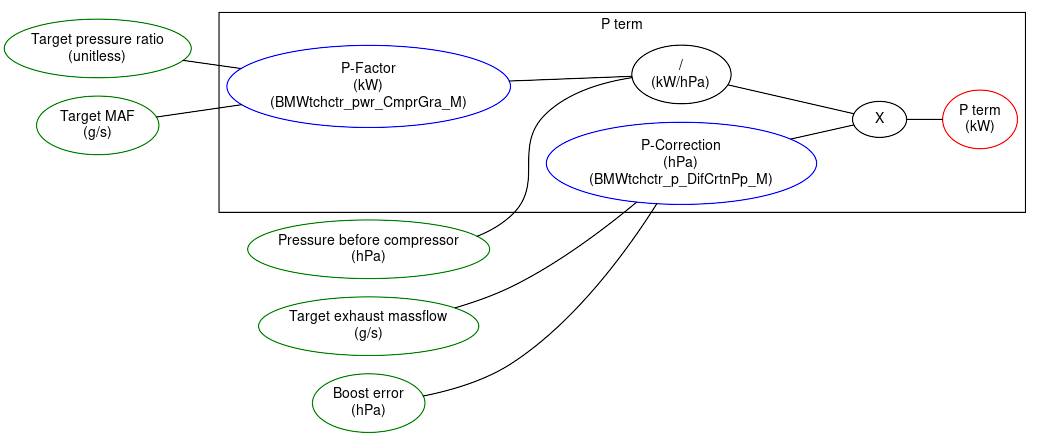
The DME then calculates a proportional error term:
This is a more subtle scenario.
Firstly we have the P-Factor (MHD's name) which is based on airflow and pressure-ratio (same as the compressor characteristic). Note that this does not depend on the boost error. It is more a property of the turbo as a system in the sense of how aggressively it responds. Note in particular
- When there is airflow through the turbo (i.e. it is spooled up), the turbo is responsive and P-Factor will be higher.
- When boost rises, the turbo has to work harder (to cut through the air, so to speak), it becomes less responsive and P-Factor will be lower.
The degree to which these effects occur depend on the turbo.
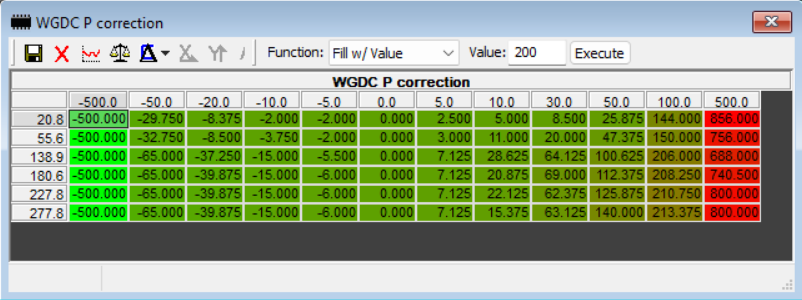
Then we have the P correction. Note that the inputs here are turbine massflow and boost error.
We note the following:
- This is where the error is factored in. When the error is zero, the value will be zero so as to cancel the P term in the PID control.
- boost error = (target - actual) so underboost is a +ve error (which is confusing because we intuively think of under as meaning less, but it is the other way around here).
- the correction provides a weighting to the boost error according to how far out of step it is with what's required in the exhaust.
- If we need a lot of exhaust flow and we are underboosting, the correction table will increase the p factor to hurry the turbo into meeting the demand.
- If we need not so much exhaust flow and are underboosting, the correction table will slow down the p factor.
- There is an additional spool mode table, however, this is often unused. The DME has a notion of spooling and an associated spooling factor which it determines from the boost error in the sense that, if we require a lot of boost but the actual boost is low, then the turbo must be spooling and so the spool factor that will be close to 1. Then, the DME can interpolate between the normal p-correction table and the spool table according to a second blending factor which it gets from a table (BMWtchctr_fac_FadeDyn_M). In practice this blending factor is zero, meaning only the normal table is used. To our mind, this is too much complexity but we mention it for anyone wanting to introduce a few more variables.
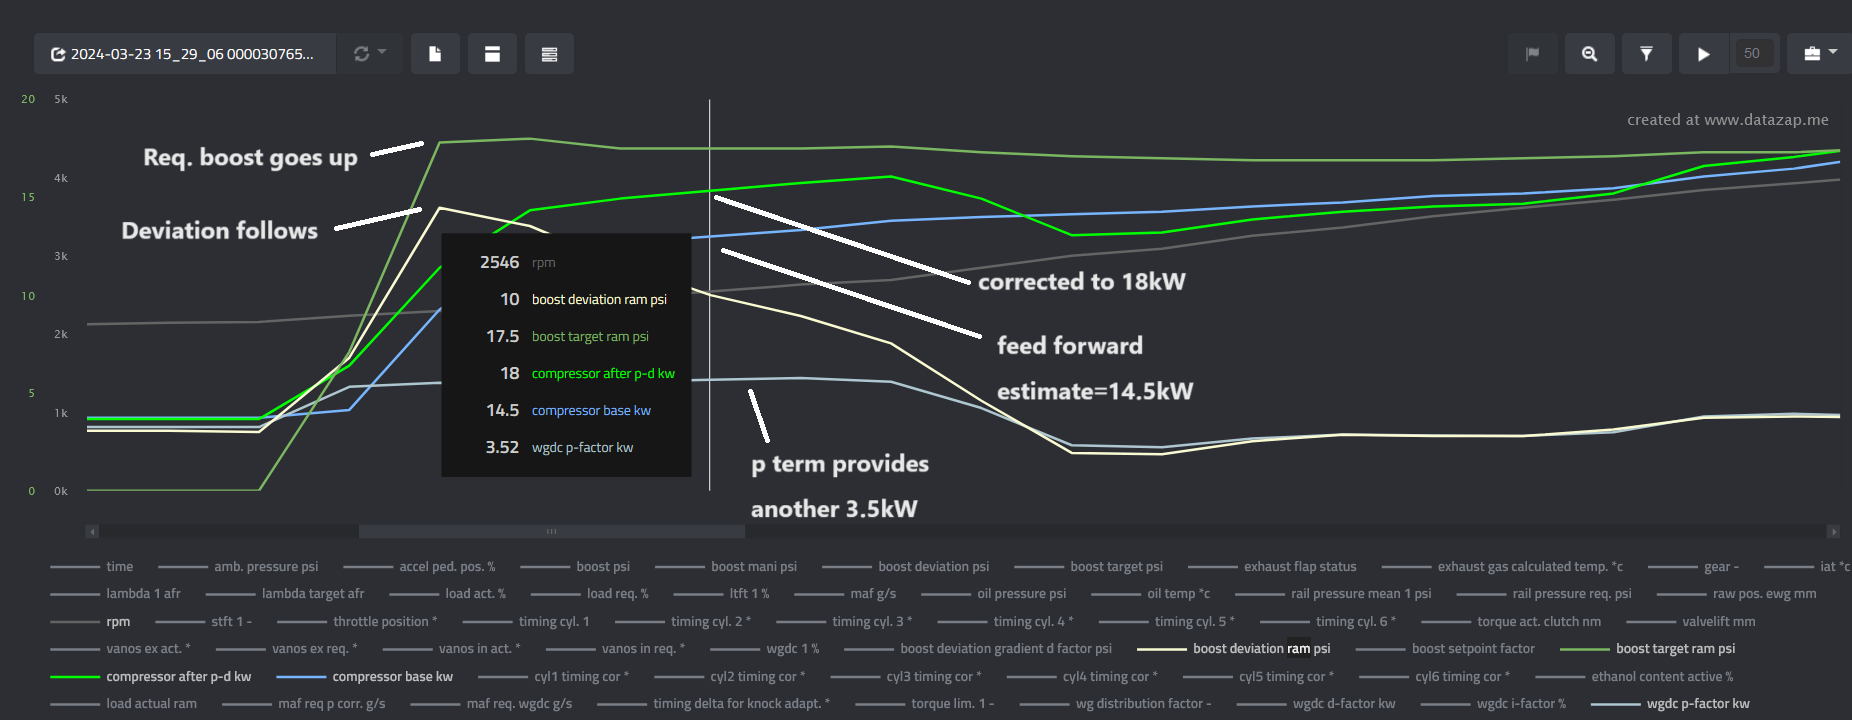
We can see this process in action in the following log:
Note that the names in the log are confusing. The 'p-factor' here is the final p term (and not the turbo gain property from the P-factor table).
D error term
Here, MHD's naming is to use D-Factor as the table which accounts for the error and D-Correction is now the power-based property-of-the-system factor.
Note that the gradient of the error is itself a pressure quantity (in hPa). As such, we think about it as the difference between successive boost error samples. (In other words, if gradient is rise/run then the rise the difference in the boost error samples but we do not bother with the run because it is always the same value.
Generally, the D-Factor values are small. This means we can worry less about them. For example, on the stock tune, with large underboost of 400 hPa (6psi) and maxed out gradient, the maximum possible D term would only adds 1.5kW to the compressor target.
| Error (hPa) | Error Gradient (hPa) | Compr Power (kW) | D term (kW) |
|---|---|---|---|
| 400 | 30 | 21 | 1.62 |
| 400 | 30 | 31 | 1.62 |
| 400 | 30 | 41 | 1.62 |
| 400 | 30 | 51 | 1.62 |
| 360 | 30 | 21 | 1.566 |
| ... | ... | ... | ... |
Generally, on logs, we want to see the feed-forward compressor map get as close to target as possible (in other words, the feed-forward compressor power and the compressor power after PD correction are the same to within a few percent). The caveat, at this point, is that we do not yet know whether the boost errors being fed back are caused by errors in our compressor map or errors in our wastegate position calculation. Let's move on to look at that problem.
Required turbine power
Once the feed forward and error terms have been calculated, the DME adds them up to arrive at a final value for the turbine power. This will be fed into the wastegate position control (see next section).
Limiting Feedforward and PID control (TchCtr_PwrFade)
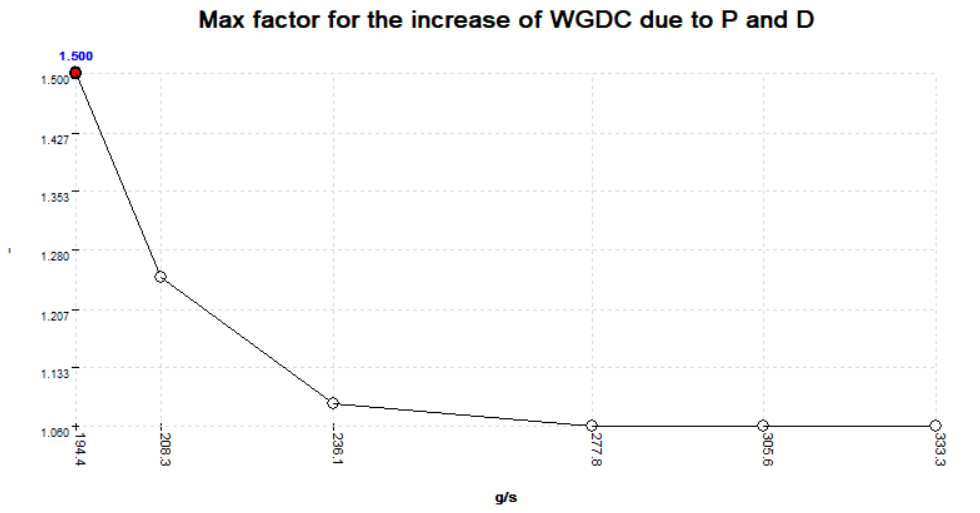
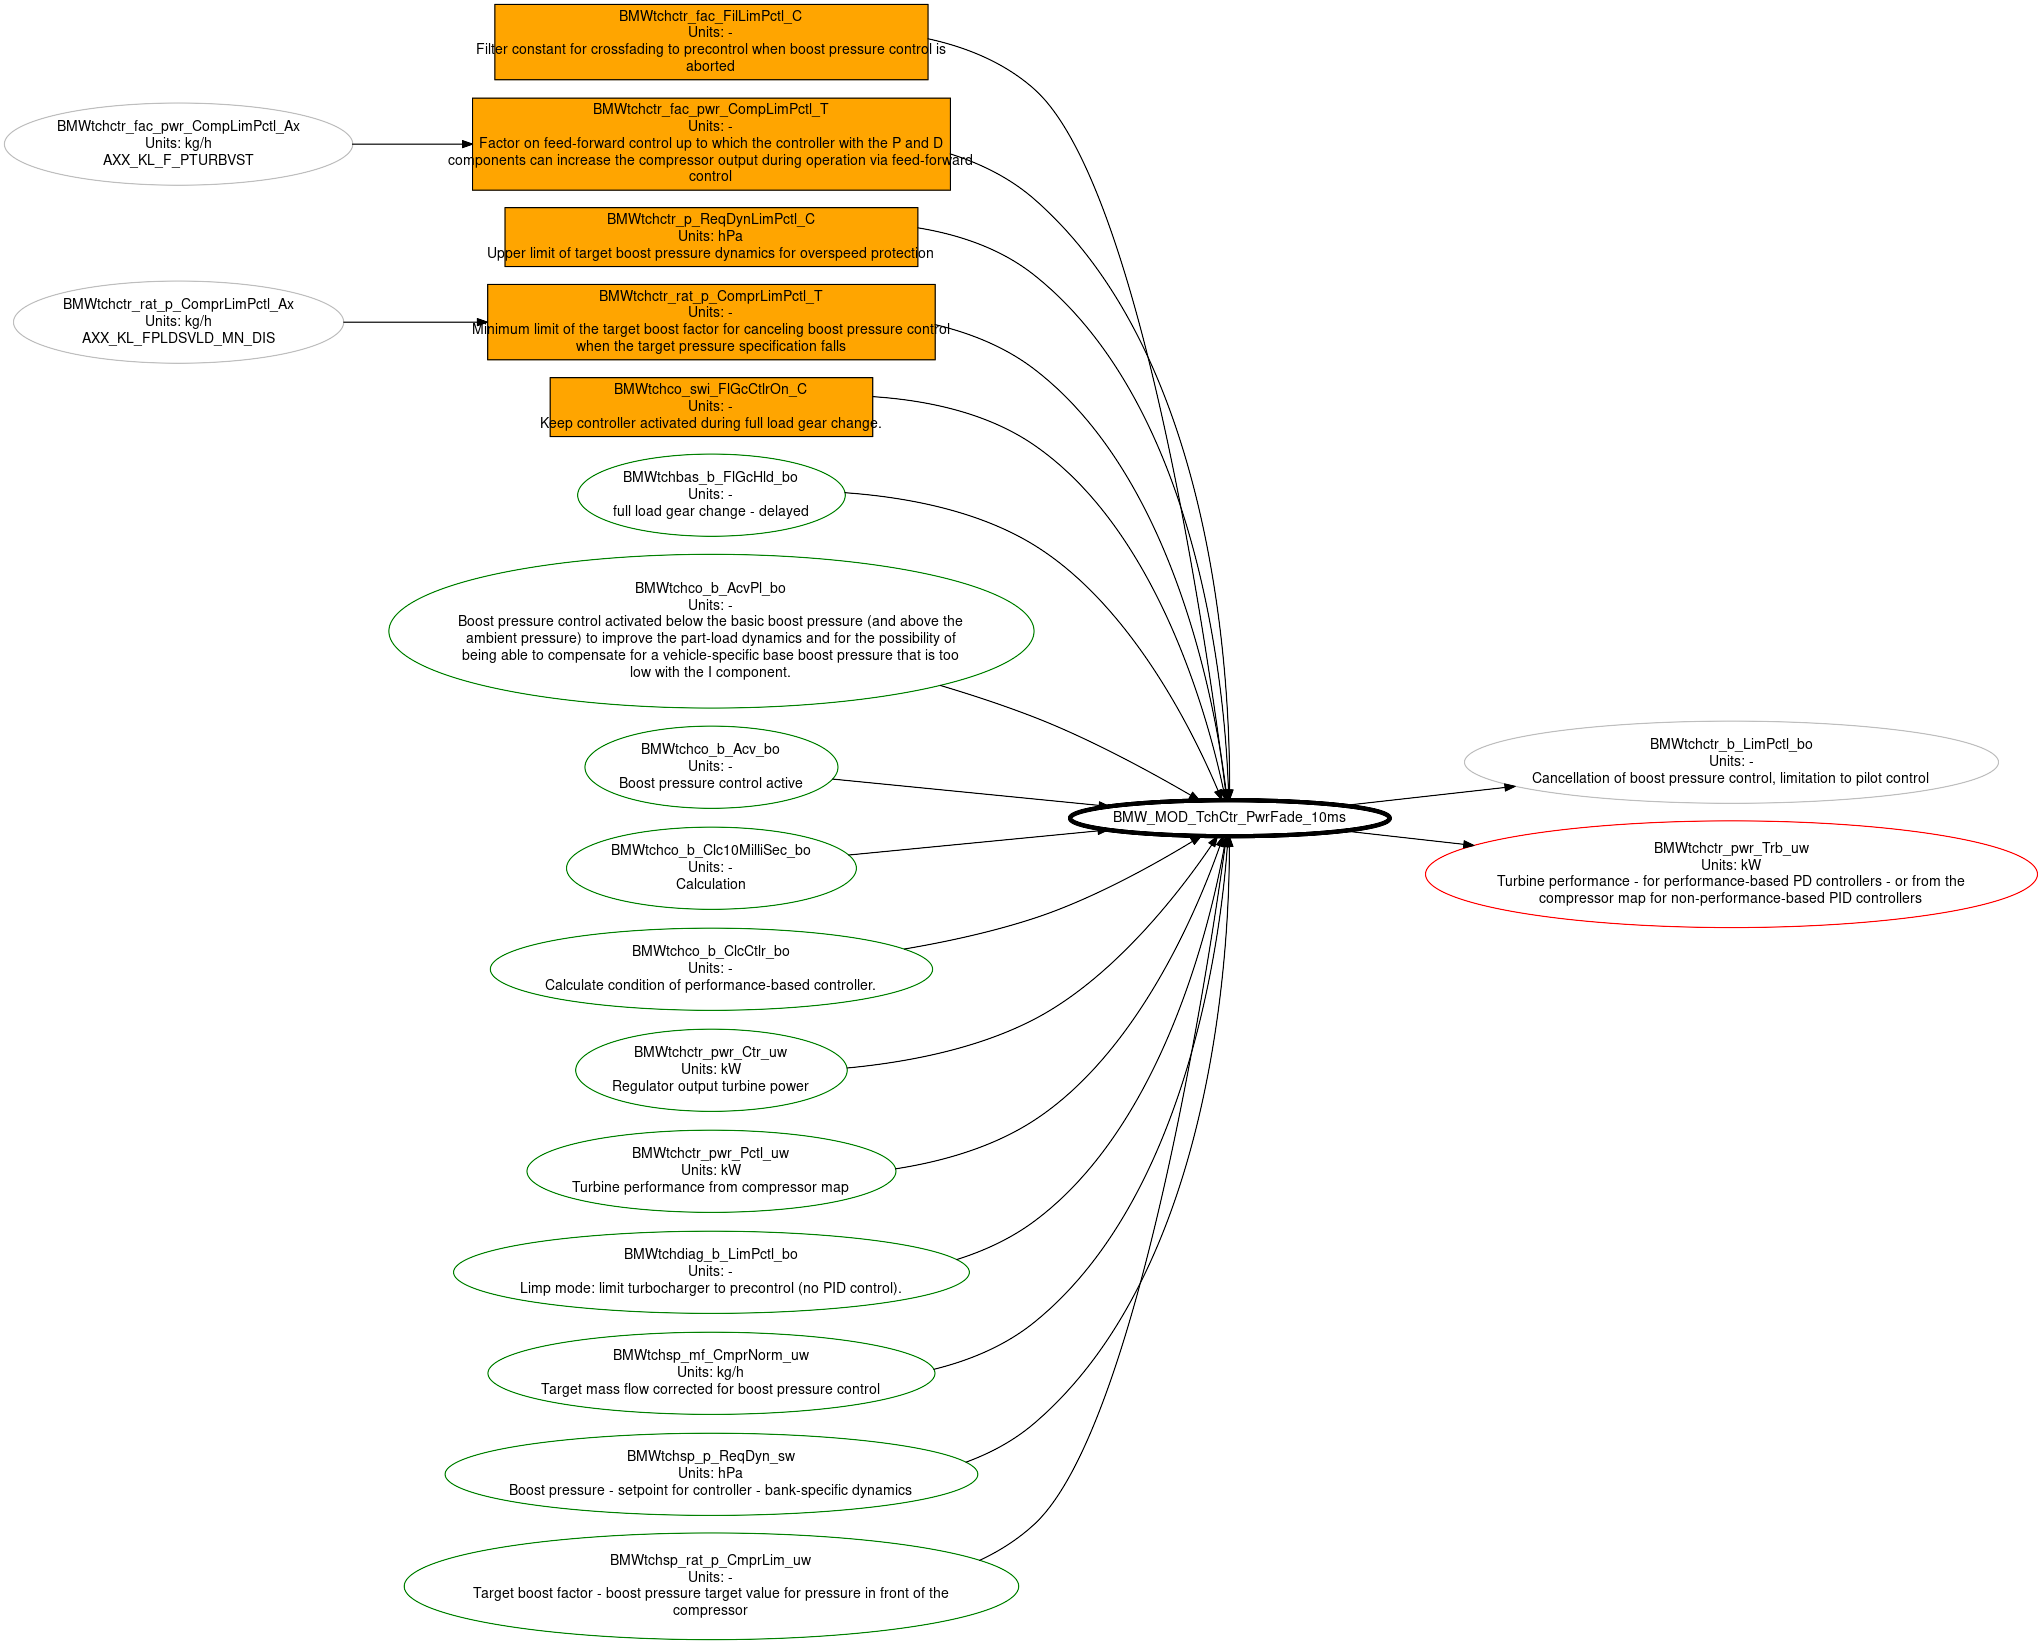
The DME caps the level to which the PID controller can increase the power from the compressor map. This cap is itself controlled by a map called BMWtchctr_fac_pwr_CompLimPctl_T or (Max factor for the increase of WGDC due to P and D in MHD's XDF files).
The calculation is . If, for example, the factor is 1.08, and the output of the PID is more than 10% more than the compressor map output then the DME will take the value from the compressor map.
Notice that the factor is MAF dependent and
- values at low to medium MAF allow the PID controller to raise the power target substantially (about 20%).
- becomes restrictive at higher MAF (down to 6%).
The breakpoints on this curve are scaled, more or less, for the mass flow range of the stock turbo. Consider rescaling the breakpoints according to the massflow capabilities of a different turbo.
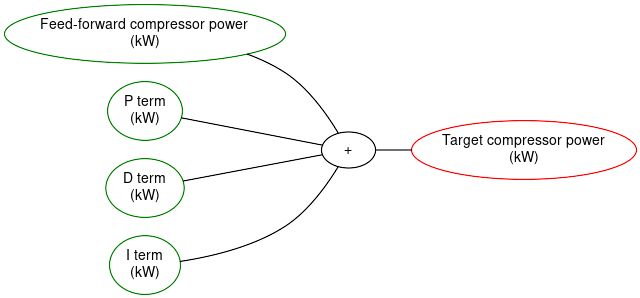
The diagram below show the blackbox view. The crucial thing is that it is outputting the actual power target that gets handed over to the turbine side.
Wastegate Position calculation (TchCtr_Pwr2Pos)
Given the required turbine power from above, the DME now calculates:
- how much of the exhaust it wants to divert through the turbine to meet this target.
- the wastegate position needed such that the remainder of the exhaust goes through the wastegate.
This introduces some new quantities:
- the turbine mass flow (a quantity in g/s or kg/h) and the turbine flow fraction which is the ratio of turbine mass flow to total exhaust mass flow.
- the wastegate mass flow and the combined (wastegate plus turbine) mass flow (which depend on the wastegate position).
- the exhaust temperature (which depends on the load)
- pressures before and after the turbine and the corresponding turbine pressure ratio (which depend on the turbo and the downpipe)
- the turbine efficiency (which depends on the turbo)
And it introduces some maps that need adjusting for non-stock turbos:
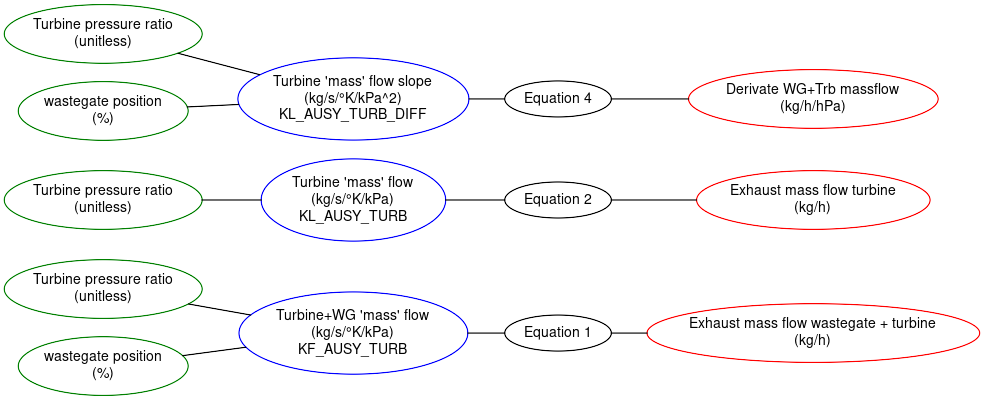
- KF_AUSY_TURB. This (and the KL_AUSY_TURB) curve below contain the results of mass flow calculations done by BMW. This is a 2D table which takes as input the turbine pressure ratio and the current wastegate position and outputs a value which, after multiplication by a couple of constants, gives the combined mass flow of the turbine and wastegate.
- KL_AUSY_TURB. This is a curve that takes as input the turbine pressure ratio and outputs the mass flow of the turbine (after multiplication by the same constants as above).
- KF_AUSY_TURB_DIFF. The formula used to calculate KF_AUSY_TURB is differentiated with respect to exhaust manifold pressure (i.e. and stored in this table.
For tuning purposes, note these tables depend on turbine pressure ratio and the breakpoints on the stock map are calibrated to 2.8. For non-stock turbos with highflow downpipes, this will need increasing because higher loads increase the exhaust manifold pressure and high flow downpipes decrease the after-turbo pressure so the pressure ratio gets bigger.
Notice that we are here trying to calculate a wastegate position (to meet our required turbine power) but some of these quantities depend on wastegate position. The calculation is iterative.
Turbine mass flow calculation
There are calculations to determine the turbine and wastegate mass flows. These massflows are then the quantities fed into the wastegate position table (see below).
This introduces some new tables:
- KF_AUSY_TURB -- this is the massflow table for the turbine + wastegate combined. This depends on both the pressure across the turbine and the wastegate position (because there will be a higher total massflow if the wastegate is open).
- KL_AUSY_TURB -- this is the massflow curve for the turbine. This only depends on the pressure ratio (because the hole has a fixed size).
- KL_AUSY_TURB_DIFF -- this is a table of the slope of the KL_AUSY_TURB.
- KL_TABG2TABG_WZINV -- this contains pre-calculated values for . It is scaled out to temps of 1400K (1125 C). (We will consider exhaust temps and pressures separately).
Stock, the massflow tables are scaled out to a pressure ratio of 2.8 so you should consider extending this for custom turbos and downpipes. (There will be higher pressure in the manifold and lower pressure after the turbo because of higher flow downpipes).
...1
...2
...3
...4
where
- is the output of map KF_AUSY_TURB (turbine plus wastegate flow map)
- is the output of curve KL_AUSY_TURB (the turbine flow curve)
- are the massflows of turbo, wastegate and turbine respectively (BMW names: Msturb, Mswg, Msturbine).
- p_{ak} is the exhaust manifold pressure (in hPa)
- t_{ab} is the exhaust gas temperature (in Kelvin)
- <math>KF\_{AUSY_DIFF} is the the output of map KF_AUSY_TURB_DIFF (the slope of the exhaust flow map).
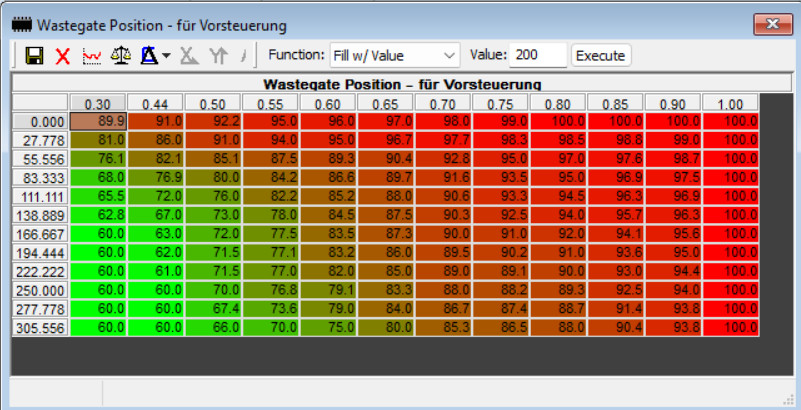
Wastegate position from turbine mass flow
Notes:
- The stock exhaust flow axis is too low for hybrid turbos and will need scaling out to about 550 g/s.
- 100% wastegate corresponds to the wastegate being closed (i.e. all flow through the turbo and none through the wastegate).
Note on MHD+ custom WGDC table based on boost and engine speed...
